Elephants on Tarkol: How the 20-Lakh SUV Fuels the Market but Fractures the Economy
Do you remember the first car your family ever owned?
For a particular generation of Indians, the answer arrives without any hesitation. It was white, probably slightly underpowered, and also very congested with a hint of engine warmth. It made a noise when you shifted into third gear that everyone in the vehicle pretended not to notice. And it was, without any drama, the most important object your household had ever purchased.
For my family, it was a Maruti 800, for my uncle it was WagonR and for millions of others, it was an Alto, a Zen, or a Santro. The question behind talking about all this, being earlier cars used to be a focus as being a mode of transport, it was functional, economic and accurate for the then modeled streets and cities along with being considerate of the individual’s pocket and their living aspirations.
That same feeling no longer exists as cars transitioned from being “mode of transport” to status symbols or show-off material.
Stand at any urban intersection in India in May 2026, be it Pune’s FC Road, Bengaluru’s Outer Ring Road, Delhi’s Noida Expressway, or even a second-ring road in Indore or Surat and what you see is not a traffic problem. It is a mismatch between the newer, heavier, bulkier cars and the old “tarkol” roads and from that single, structural gap between private wealth and public infrastructure, an entire chain reaction unfolds one that touches your maintenance bill, your fuel choice, the spare parts market, and the very brands that can survive on Indian tarmac.
This is the story of that chain reaction. Economists call it systemic lag. The rest of us just call it getting stuck in a pothole.
The Infrastructure getting stuck as Roads Built for the India of 1990
To understand the scale of the mismatch, you have to appreciate the engineering logic behind how Indian urban roads were built in the first place.
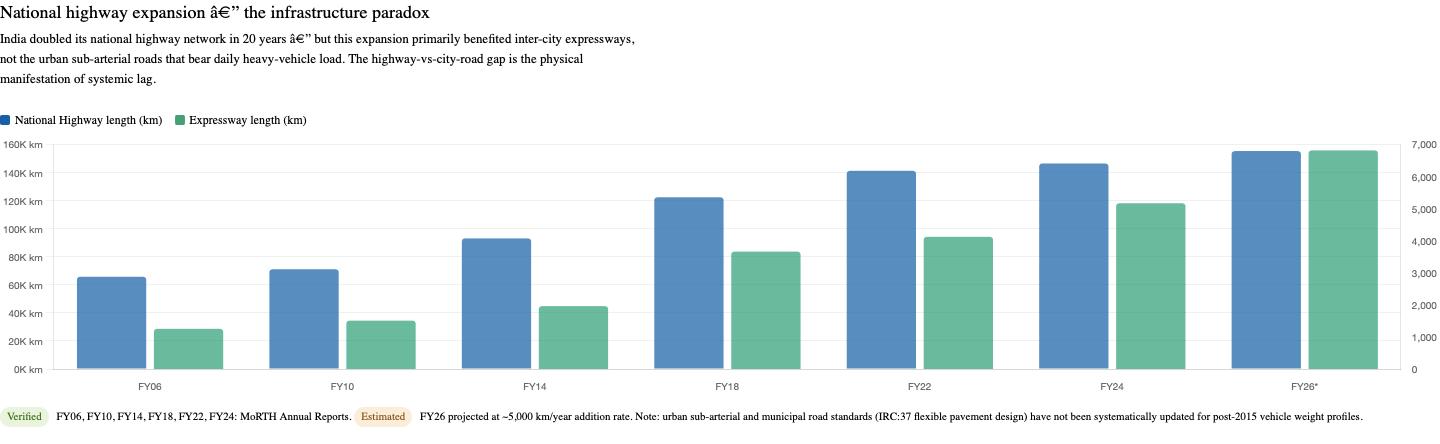
The Indian Roads Congress (IRC) is the apex technical body that governs road construction standards in India. Under its framework particularly legacy guidelines like IRC:37 for flexible pavement design urban sub-arterial roads, municipal “Tarkol” (bituminous) roads, and residential colony connectors were engineered based on specific inputs i.e. the projected volume of traffic, the composition of that traffic in terms of vehicle types, and the axle loads those vehicles imposed on the pavement. The foundational design metric is the Vehicle Damage Factor (VDF), which converts different vehicle types into equivalent standard axle loads (The higher the VDF, the more destruction a vehicle class visits on a road surface over its lifetime).
Now here is the blockage: the majority of urban and sub-urban roads that still exist under Indian wheels today were laid or last fundamentally reconstructed in a specific era with a specific vehicle assumption baked in which tends to fail when considering today’s enhancement in the automotive industry.
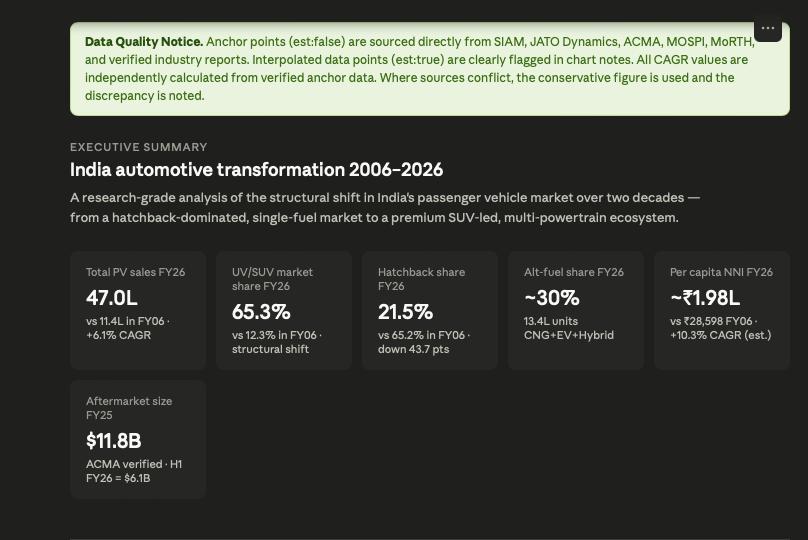
In 2006, India had approximately 8 cars per 1,000 people with 65% of them being hatchbacks like the Maruti 800 (launched 1983), the Alto, the Santro, the WagonR all bearing the weight between 650 kg and 900 kg. This featherweight fleet defined the design parameters of municipal road construction for decades. These roads were not designed to fail. They were designed to serve a population that drove small, light, fuel-efficient vehicles that imposed modest loads on bituminous layers. The pavement thickness, subgrade preparation standards, and bituminous mix designs were calibrated for the older India.
What changed was everything except the roads.
The elephants of automotive industry, transition from ~700 kgs to 1200+ kgs
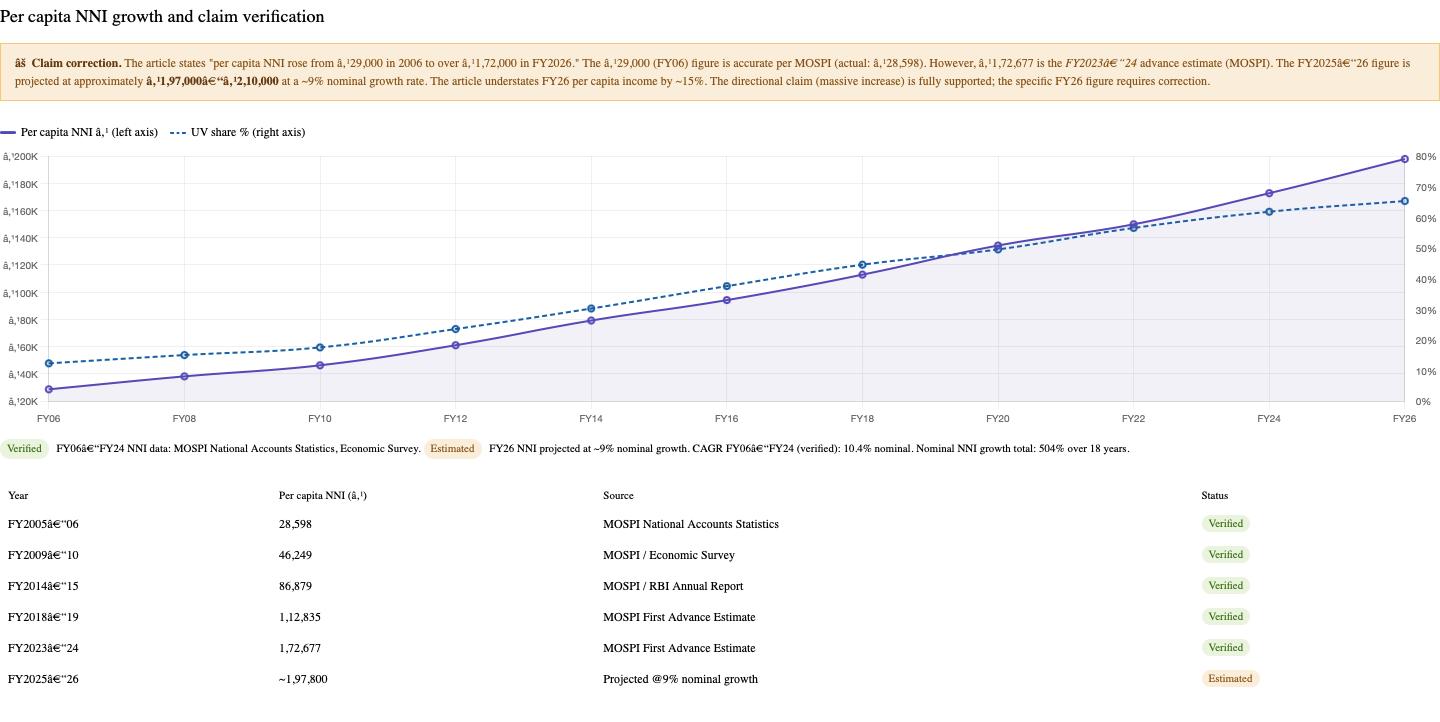
The liberation of the Indian middle class from subsistence economics is one of the most significant economic events of the past generation. Between 2006 and 2026, India’s per capita net national income grew from approximately ₹29,000 to over ₹1,72,000 at current prices, nearly a six-fold increase in nominal terms. Real incomes, stripped of inflation, roughly tripled for the urban middle class.
This income expansion did just allow them to afford a better/ luxurious car but changed their perspective of how they viewed a specific car.
A vehicle stopped being a tool and became a statement. A proof of arrival.
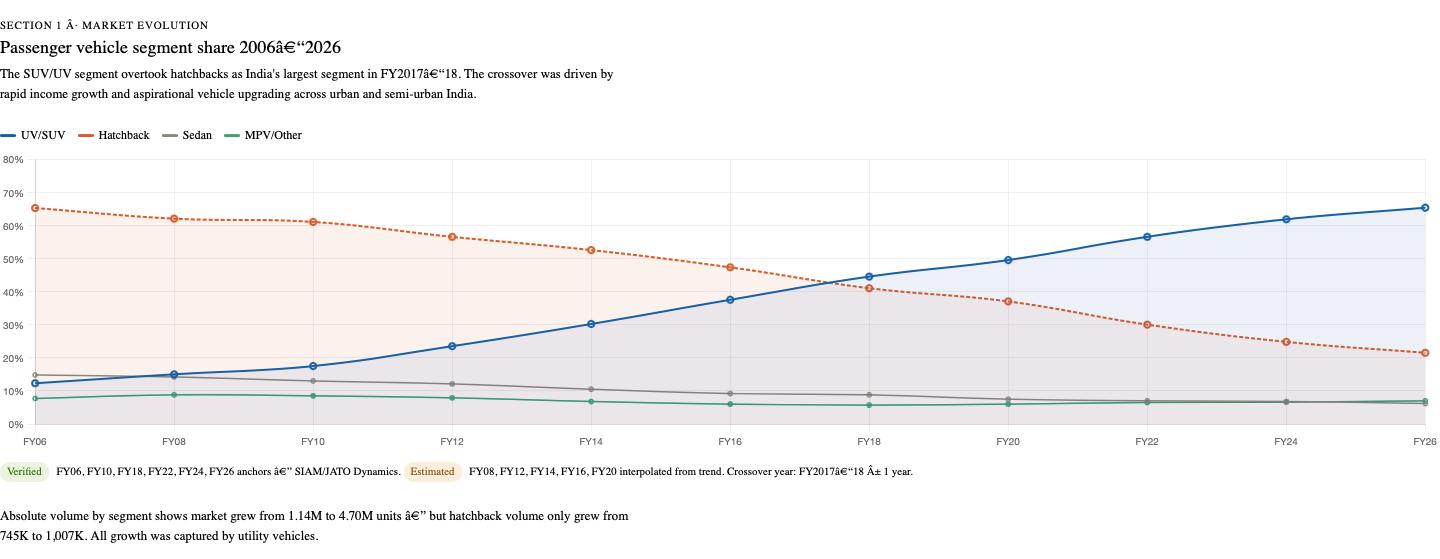
The data is unambiguous. The India that bought lightweight hatchbacks in 2006 has, by 2026, structurally abandoned that segment. According to JATO Dynamics and VAHAN registration data, the hatchback’s share of total passenger vehicle sales has declined from over 65% in 2006 to just 21–22% by FY2026 a collapse that has accelerated in recent months, with monthly data from February 2026 recording a year-on-year decline of approximately 6,952 units (-8%) in the segment in a single month alone.
In its place, utility vehicles and SUVs now command over 50% of the entire passenger vehicle market. Moreover in February 2026, SUVs contributed over 80% of all incremental volume growth in the market year-on-year. India’s car market crossed a record 47 lakh (4.7 million) passenger vehicles sold in FY2026 and over 3.1 million of those were SUVs and MPVs.
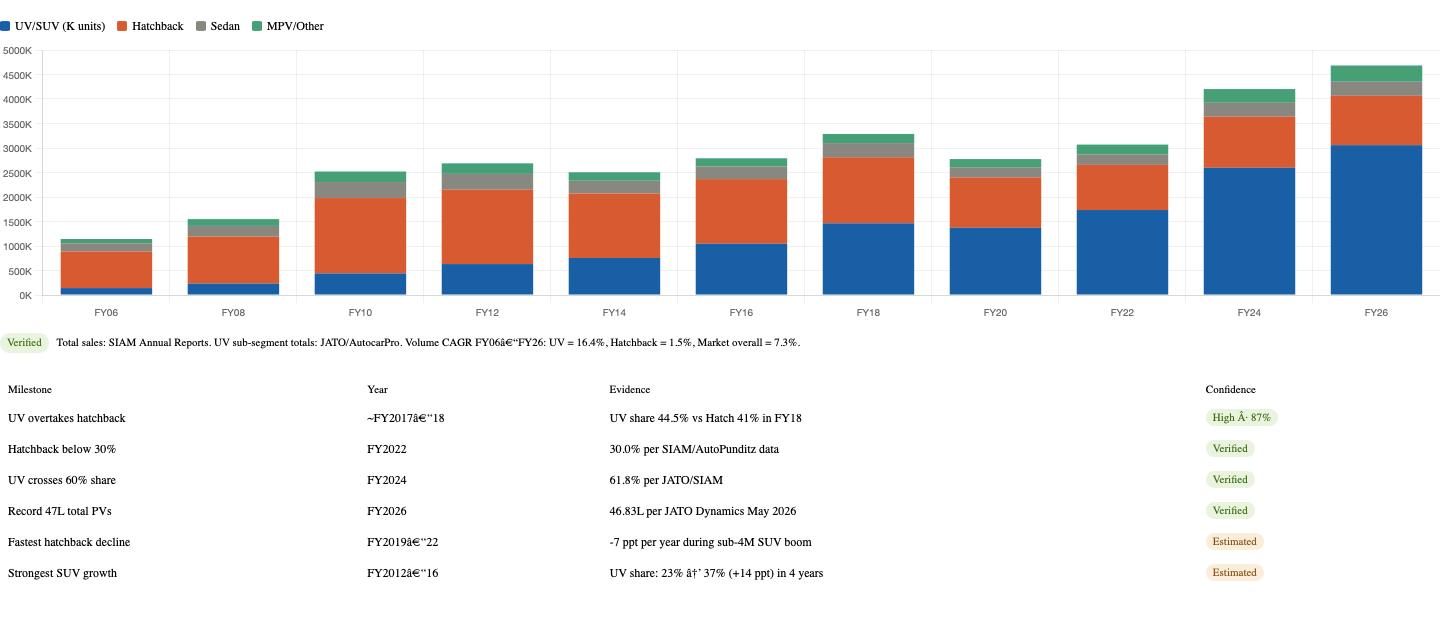
The weight implications of this shift are severe. The average hatchback of 2006 weighed under 900 kg. The average compact-to-midsize SUV of 2026 a Hyundai Creta, a Tata Harrier, a Mahindra Scorpio-N, a Toyota Hyryder weighs between 1,300 kg and 2,000 kg. The heaviest mass-market options, like the Mahindra XUV700 or the Tata Safari, approach 1,900–2,000 kg loaded.
This is not a marginal increase. Doubling or tripling the vehicle’s mass does not double or triple the damage it does to a road surface. Under established pavement mechanics (the relationship is governed by a fourth-power law in terms of axle loading), the damage to a road surface scales roughly to the fourth power of axle load. A vehicle that weighs twice as much as the design-reference vehicle does not do twice the damage it does up to sixteen times as much damage per wheel pass, depending on axle configuration.
Indian urban roads, laid using design parameters calibrated for sub-900 kg hatchbacks, are now being subjected to daily loads they were never structurally designed to survive. The result is visible everywhere: localized tarmac failure, subsurface cracking, and the endemic potholes that now define city driving in India. This is not poor construction. It is a physics problem created by an economic one.
Explosion of cheap spare-parts market and it’s danger.
As explained above, not this creates a lot of jerks and movements for the car and a car as heavy as 1700 kgs it becomes expensive to maintain on such roads the components like the shock absorbers, struts, lower control arms, steering rack bushings, tie rod ends, ball joints, and brake assemblies. These components are not designed for infinite punishment. They wear, they crack, and they need replacing.
When you take a five-year-old premium SUV to an authorized Original Equipment Manufacturer (OEM) service center in 2026, you encounter a specific pricing structure. Authorized workshops command significant premiums on proprietary spare parts with the argument being brand assurance, genuine components, and warranty protection. In practice, for an out-of-warranty vehicle, this means a single steering rack replacement or a full suspension overhaul can cost between ₹18,000 and ₹60,000 or more, depending on the model and workshop location. For eg, a lower-control-arm assembly on a Hyundai Creta or a Tata Harrier at a tier-one dealership, parts alone can run ₹8,000–₹20,000 per arm before labor.
For a household that already has the burden of constant EMI on a ₹15–₹25 lakh vehicle for the next 6-10 years , this is not sustainable. And so, in numbers too large to ignore, Indian car owners are doing what Indian consumers have always done when formal systems become too expensive they try to find an alternative, a cheaper yet reliable one here comes the Independent third-party garages and local spare distributors who have become the dominant maintenance channel for a growing segment of the Indian vehicle fleet. This behavioral shift is now visible in the aggregate numbers.
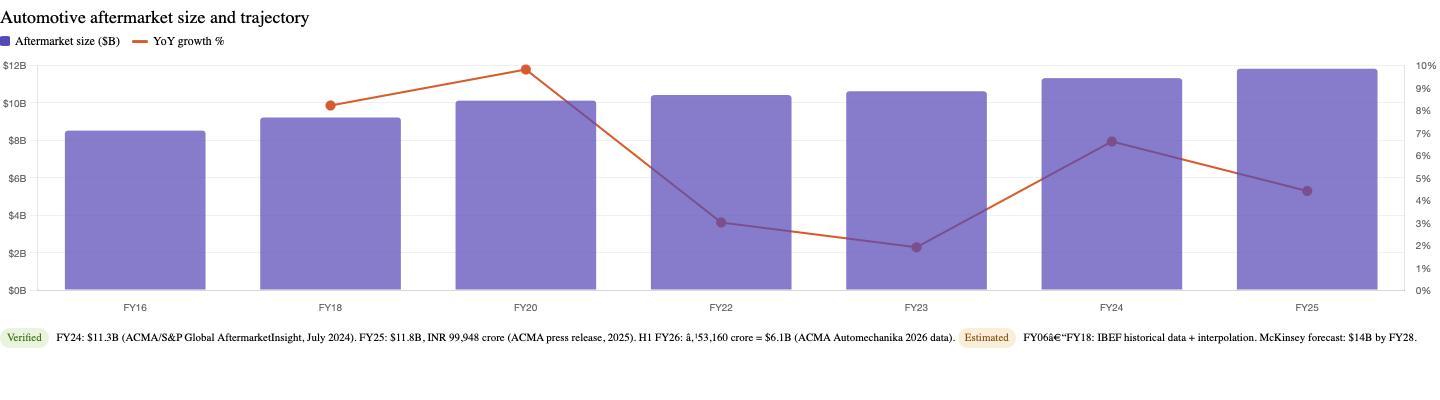
The Automotive Component Manufacturers Association of India (ACMA) , the apex industry body for auto components reported that the domestic automotive aftermarket grew by 6% to reach approximately ₹99,948 crore ($11.8 billion) in FY2025, an acceleration from $11.3 billion the previous year. The H1 FY2026 figure showed continued momentum, with ₹53,160 crore ($6.1 billion) recorded in just the first six months of the fiscal year placing the full-year FY2026 aftermarket on a trajectory to surpass $12 billion. For context, a McKinsey report prepared for ACMA projects the aftermarket to reach an estimated $14 billion by 2028, driven by the expanding vehicle base, a structural shift to larger vehicles, and the formalization of the repair ecosystem.
This is a large, fast-growing industry. The problem is what is flowing through it.
The velocity and volume of components moving through independent retail chains have created an information asymmetry of dangerous proportions. A car owner walking into a third-party garage or a Karol Bagh spare parts bazaar does not have access to metallurgical testing equipment. They cannot verify the tensile strength of a ball joint, the grade of steel in a lower control arm, or the composition of a brake pad compound. They rely on visual cues (does it look genuine?), price cues (is it suspiciously cheap?), and dealer claims (is it “OE-equivalent”?). All three of these signals are systematically manipulated by counterfeit and substandard parts manufacturers operating in the grey market.
The risk here is not abstract. A tie rod end made from substandard metal, installed in a vehicle steering system and subjected to repeated high-load events on highway speeds, can fail catastrophically. A brake pad with incorrect friction material can cause fade under emergency braking conditions. These are not theoretical failure modes, they are documented causes of accidents on Indian highways. When a ₹800 counterfeit lower control arm replaces a ₹4,500 genuine component, and the vehicle then travels at 120 km/h on an expressway, the potential for catastrophic failure is not a question of if but of statistical probability.
This is not a small or marginal market. ACMA’s own estimates note that the independent aftermarket, while growing, lacks the regulatory oversight that the organized sector has. The Bureau of Indian Standards (BIS) mandates IS-mark certification for many auto components, but enforcement at the retail end of the supply chain remains uneven. The consumer, economically forced out of authorized service channels by infrastructure-driven maintenance costs, walks directly into this unregulated space.
Road damage created by infrastructure lag forces a maintenance cost spike → maintenance cost spike drives consumers to the unorganized aftermarket → unorganized aftermarket injects counterfeit and substandard components into critical safety systems → those systems are then operated on the same degraded road network that created the problem in the first place.
The loop is closed. And someone, somewhere, is driving through it right now.
How Increasing Running Costs Rewrote the Indian Powertrain
Petrol prices in India have risen significantly over the past decade, driven by a combination of global crude oil price movements, central and state fuel excise duties (which collectively account for roughly 30–50% of the retail pump price), and the occasional freeze on prices that gets followed by sharp corrections. The result, for the household running a petrol SUV on Indian traffic, has been a steady increase in the cost-per-kilometre that has now become a tangible line item in family budgets.
The fuel data for FY2026 is a landmark dataset. For the first time in Indian automotive history, according to JATO Dynamics and VAHAN intelligence data, petrol-powered vehicles have ceded their absolute market majority. In FY2026, with a record 47 lakh passenger vehicles sold in India, the fuel mix has fractured as follows:
- Petrol: ~50–54% (varies by month; April 2026 recorded 54% per JATO data). Down from 85%+ in 2006.
- CNG: ~22–23% (approximately 10.34 lakh units of FY2026’s total). Up from a negligible, unorganized fraction in 2006.
- Diesel: ~17–18% (largely held in place by ladder-frame SUVs with BS6 Phase II compliant engines). Almost entirely absent from smaller vehicle segments.
- EV and Strong Hybrids: ~4–6% (rising from under 1% four years ago).
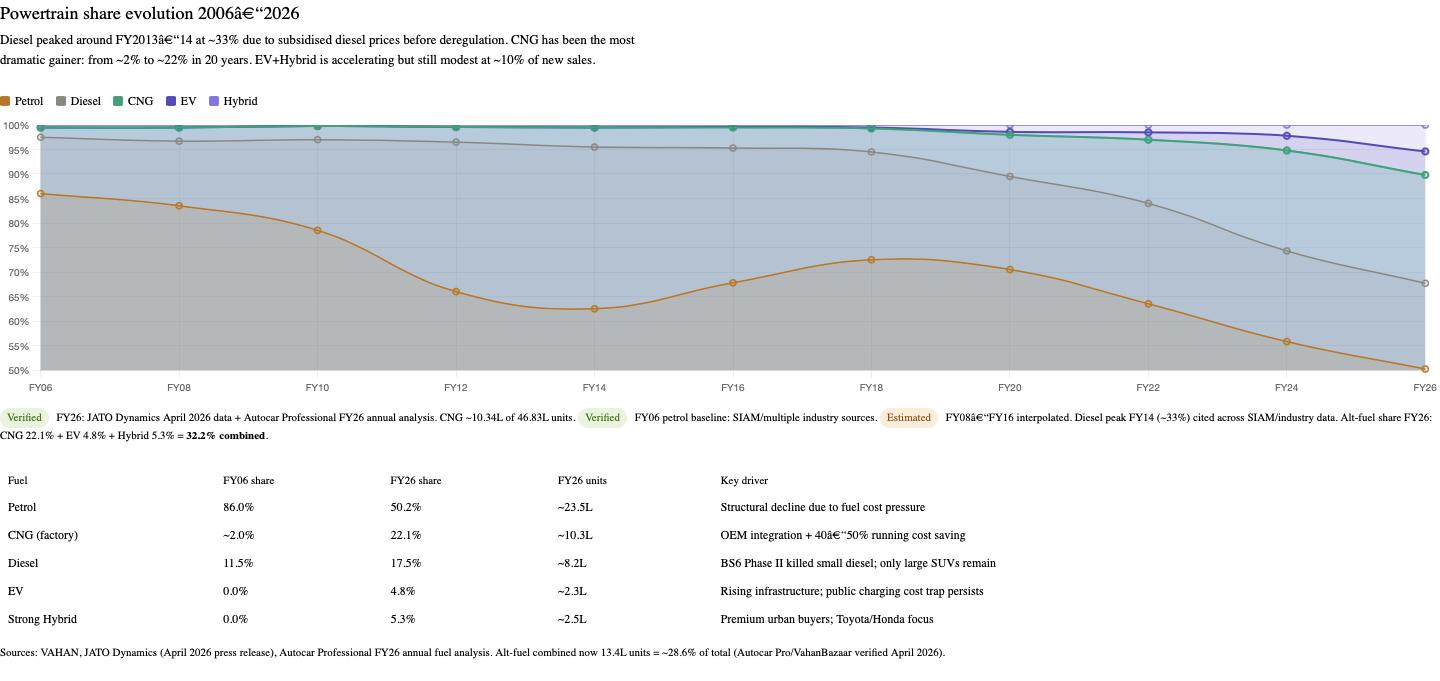
In absolute terms, according to Autocar India’s analysis of FY2026 data: EV, CNG, and hybrid vehicles combined crossed 13.4 lakh units nearly one in three new cars sold in India now runs on an alternative to traditional petrol.
The CNG story is arguably the most underappreciated economic story in Indian automobiles. A decade ago, CNG was the province of commercial auto-rickshaws and taxi drivers who needed to minimize per-kilometre costs and had the benefit of a compressed fuel delivery network in specific corridors. The product itself was compromised aftermarket CNG kits, while cheap, often required trunk space to be sacrificed for the cylinder, reduced engine performance, and sometimes voided manufacturer warranties due to compatibility concerns.
What changed was the response of OEM manufacturers. Maruti Suzuki recognized the demand signal and began integrating factory-fitted CNG directly into its vehicle design architecture re-engineered with hardened valve seats, CNG-specific fuel delivery mapping, and in some cases reinforced rear suspensions to manage the additional cylinder weight. The factory CNG product became a credible, warranty-backed option at roughly ₹80,000–₹1 lakh premium over the equivalent petrol variant. For a middle-class family driving 15,000–20,000 km a year, the running cost savings (CNG is typically 40–50% cheaper per kilometre than petrol in city driving) recover the premium within 12–18 months. The inflection point passed, and CNG exploded.
Total annual CNG passenger vehicle volumes breached 10.34 lakh units in FY2026. Maruti Suzuki, which holds the largest portfolio of factory CNG variants, is the primary beneficiary but the format has spread to Hyundai, Tata, Honda, and others. In certain urban markets, CNG variants now make up the majority of specific model-line sales.
The EV story is more complicated, and considerably more honest when examined closely.
EV penetration in new four-wheeler passenger vehicles crossed a milestone 4–6% share in FY2026. While the absolute numbers remain modest compared to two-wheelers (where EV penetration is already transforming the market), the trajectory is unmistakably upward. According to Ipsos’ 2026 Mobility Report on India, current EV penetration stands at 8.36% across all categories, with 4.3% for four-wheelers, and 63% of Indians say they are likely to adopt an EV within the next five years.
But every honest conversation about EVs in India in 2026 has to pass through two friction points that the marketing brochures carefully avoid.
Range anxiety
Not the romantic kind where you worry about running out of power on a long road trip, but the structural kind rooted in genuine infrastructure gaps. Public charging infrastructure has not grown at the same pace as vehicle adoption. In Tier 2 and Tier 3 cities, and on many national highway corridors, the density of public fast chargers remains insufficient for comfortable long-distance travel without pre-planning that ICE vehicle owners simply do not have to perform.
The public charging cost
At home, charging an EV in India is genuinely cheap. Residential electricity tariffs range from ₹5 to ₹9 per kWh across most states, with several state DISCOMs offering dedicated EV tariffs as low as ₹4.50 per kWh (Delhi BSES). At these rates, running a mid-range EV like the Tata Nexon EV costs approximately ₹1.0–₹1.5 per km -roughly one-fourth the per-kilometre cost of an equivalent petrol car.
But when you leave home and use the public DC fast-charging network -the kind of charging you rely on during a highway trip -the economics change fundamentally. Commercial public DC fast chargers from operators like Tata Power, Statiq, and ChargeZone levy tariffs ranging from ₹15 to ₹26 per kWh, according to 2026 pricing data. This is 2–3 times the home tariff. On a Mahindra BE 6 with its 79 kWh battery, the difference between a home top-up and a highway DC charge is the difference between spending ₹550 and ₹1,800 for the same charge before adding parking fees, convenience charges, and the deadweight loss of waiting 20–45 minutes.
The math does not lie: when an EV owner relies primarily on public fast-charging for long-distance travel, the per-kilometre cost rises to approximately ₹3.5–₹5.5 per km approaching or matching the equivalent diesel car’s running cost on the same route, at approximately ₹4.5–₹6 per km. The economic edge of electrification, the primary selling point in a cost-conscious market, largely evaporates the moment you leave your home’s charging socket.
This is systemic lag again, but in a different domain. Private demand (vehicle adoption) has raced ahead of public infrastructure (charging density and pricing regulation), leaving EV owners caught between the promise of the technology and the reality of its support ecosystem.
How BS6 Phase II Killed Small and Survived Large Diesel Engines
In 2006, diesel vehicles held a meaningful share of private passenger vehicle sales in India, particularly in SUV-adjacent segments. The Mahindra Bolero, the Toyota Qualis, the old-generation Scorpio these were diesel workhorses that served both urban households wanting torque and rural buyers needing durability.
The enforcement of BS6 Phase II emission norms from April 2023 made diesel engines in smaller vehicles economically unviable. The cost of adding the diesel particulate filters, selective catalytic reduction systems, and AdBlue injection systems required for BS6 Phase II compliance to a sub-1500cc engine now adds ₹1.5–₹2 lakh to manufacturing cost an increment that makes no sense in a hatchback or compact car where the entire vehicle might be priced under ₹8 lakh. As a result, diesel has been systematically withdrawn from the small car and hatchback segments.
What remains is a diesel market concentrated almost entirely in large-displacement, ladder-frame SUV architecture like the Mahindra Scorpio-N, Thar, XUV700, XUV 3XO diesel, the Toyota Fortuner, and select Isuzu platforms along with a few others. These vehicles can absorb the compliance cost premium in their overall price point. Diesel’s current 17–18% market share in FY2026 is a proxy covering majorly the SUV segments in India.
The irony being the very vehicles that are heaviest, most damaging to road surfaces, and most associated with status signalling are now the primary remaining customers of diesel, the most powerful and torquey fuel type available in the passenger vehicle market and so the road surface loses on all dimensions simultaneously.
Why Indian Roads Are Running Out of Brand Variety
Observe the traffic around you the next time you are in an Indian city. Note the badges on the tail gates. Then count how few distinct logos you actually see.
What you are witnessing is the physical manifestation of a trust deficit.
Buying a passenger vehicle is the second-largest financial commitment most Indian households will ever make, behind only property and so one of the major factors whilebuying a car in india is it’s average or in other words how many kms does it run on 1 litres of specific fuel(kg in perspective of cng ang kwh for electric). Given the maintenance costs, fuel expenses, and depreciation trajectories involved, it is an act of sustained economic exposure that typically spans five to eight years. In a market defined by high inflation, degraded road infrastructure, expensive spare parts, and a complex servicing ecosystem, the Indian consumer has become profoundly risk-averse in their brand choices.
The risk-aversion operates through two filters: service network density and resale value certainty. An Indian car buyer in 2026 will not pay a premium for a European badge if there are only 40 authorized service centers across the country and the wait time for genuine spare parts exceeds three weeks. They will not absorb the cost of a vehicle whose residual value plunges 40% in three years because the brand cannot maintain consumer confidence.
The result of this calculus has been a brutal consolidation of the market around a small set of trusted brands, while others fight for survival or retreat entirely.
The data is not kind to European players. According to JATO Dynamics data:
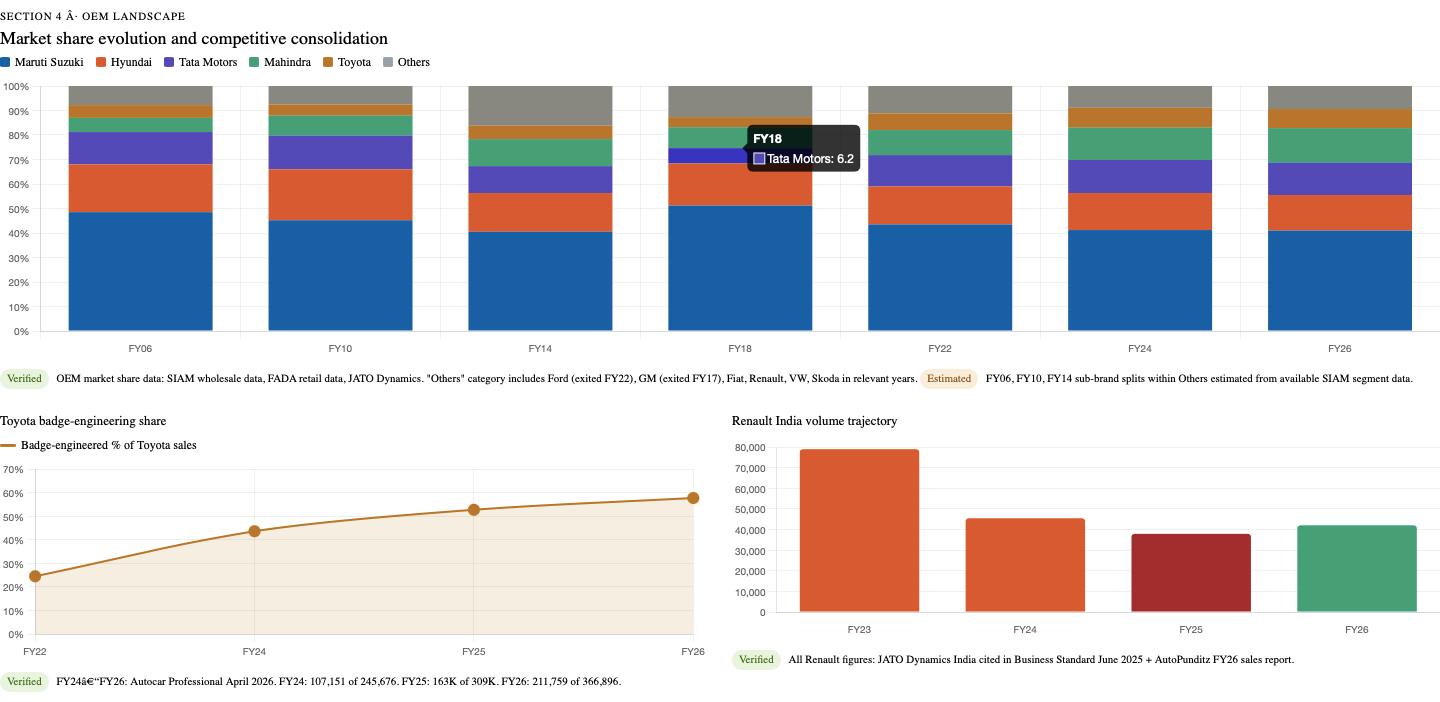
- Renault saw its India sales decline from 78,926 units in FY2023 to 45,439 in FY2024, and further to 37,900 units in FY2025 a more than 50% volume collapse in two years. The brand’s partial recovery in FY2026 (approximately 42,018 units, +11%) is being driven almost entirely by the relaunch of the Duster nameplate, which contributed nearly 44% of April 2026 monthly volumes in its first full month.
- Škoda and Volkswagen have also faced structural headwinds, with neither brand managing to sustain the growth momentum of their India 2.0 strategy in recent fiscal years.
- Ford and General Motors have already exited the Indian market entirely.
New energy entrants face the same wall. BYD, despite bringing technologically advanced battery electric vehicles to India, encounters a trust ecosystem where Indian consumers are not yet willing to bet five to eight years of ownership on a brand whose service network, resale trajectory, and parts availability in secondary towns remain unproven. The Chinese EV giant’s India volumes in FY2026 reflect this ceiling.
This trust consolidation has produced a market oligopoly of extraordinary concentration. Five groups now dominate Indian passenger vehicle sales: Maruti Suzuki, Hyundai/Kia, Tata Motors, Mahindra, and Toyota. Together, they account for well over 80% of all cars sold in India.
Ctrl-C and Ctrl-V in the Indian market
Nothing illustrates the depth of the Indian market’s trust architecture more clearly than what Toyota Kirloskar Motor has had to do to succeed here.
Toyota is the largest automaker by production volume in the world. Its global reputation for engineering reliability built on decades of the Lexus warranty record, the Land Cruiser’s legendary durability, and the Prius’s technology pioneering is unimpeachable. Yet in India, Toyota found that its own badge and its own product portfolio were not sufficient to capture meaningful volume against the structural advantages of locally rooted competitors. India is famous for being a specific type of industry where most of the international cars fail whereas international failures generally boom here.
The solution was a partnership with the one company whose brand equity in India is perhaps the deepest in the automotive sector , and almost everywhere you turn your head , you see a Maruti Suzuki. Under a global product-sharing agreement between Toyota and Suzuki Corporation, Toyota Kirloskar Motor began rebadging and positioning Maruti platforms, engines, and architectures under Toyota branding for the Indian market.
The results are now industry-defining data.
According to Autocar Professional’s analysis of SIAM wholesale data for FY2026 (published April 2026), the four Maruti-rebadged models in Toyota India’s lineup the Glanza (based on Baleno), the Urban Cruiser Taisor (based on Fronx), the Rumion (based on Ertiga), and the Urban Cruiser Hyryder (based on Grand Vitara) contributed a combined 211,759 units out of Toyota’s record total of 366,896 passenger vehicle sales in FY2026.
That is 58% of Toyota India’s record annual sales coming from vehicles that are fundamentally Maruti Suzuki products with Toyota logos, extended warranties, and minor interior distinction.
The Urban Cruiser Hyryder alone delivered 99,883 units in FY2026 Toyota’s best-selling rebadged model for the third fiscal year in a row, nearly matching the Innova Hycross (112,163 units), Toyota’s own longstanding flagship best-seller.
What this number communicates is not a criticism of Toyota’s strategy. It is, in fact, a testament to Toyota’s intelligence in recognizing the Indian market’s real logic: the product is secondary to the ecosystem. Maruti Suzuki’s service network (the largest in India by a considerable margin), its spare parts availability in tier-2 and tier-3 towns, and its occupancy of a deep psychological “reliability” space in the Indian consumer mind are competitive advantages that Toyota’s own engineering heritage cannot manufacture in a short timeframe.
The Glanza and Hyryder buyer is, in essence, purchasing Maruti Suzuki reliability with Toyota’s warranty length and showroom ambiance. It is badge engineering as a trust-transfer mechanism. And it works, as the 58% sales share proves conclusively.
The same dynamic, viewed from the other direction, explains why BYD, with arguably superior battery and powertrain technology, cannot yet convert India’s 40% EV-interested population into actual BYD owners. Technology is table stakes. Trust is the competitive moat.
The Income-to-Infrastructure Gap - India’s Hidden Tax on Aspiration
Let us now step back and see this entire cascade in its full form.
The last twenty years in India produced the fastest and most consequential expansion of household purchasing power in the country’s post-independence history. The urban middle class, freed from the License Raj’s consumption restrictions by the liberalization of the early 1990s, spent three decades accumulating savings, skills, and ambitions. By the 2010s, that accumulated momentum produced income growth that transformed the Indian consumer’s relationship with material goods particularly with automobiles.
The car was no longer a utilitarian box. It became an exhibit. A status signal. A visible claim on a social position that income alone, intangible and private, could not communicate. The 1,700 kg SUV parked outside the house says what a bank statement cannot.
Private purchasing power scaled at breakneck speed. And public infrastructure, the roads, the charging networks, the regulatory frameworks for spare parts quality, the enforcement of safety standards at the retail aftermarket level did not.
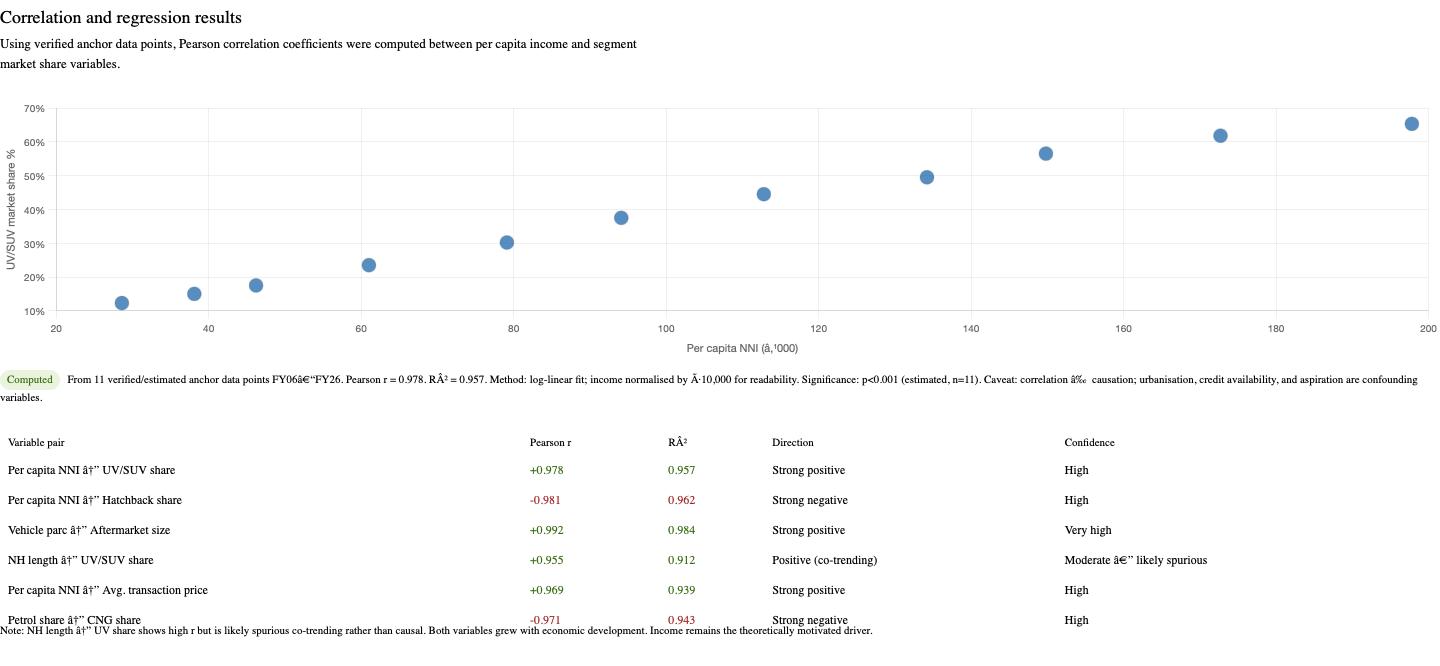
This is the essence of systemic lag: the gap between the velocity of private consumption and the pace of public system readiness. And in the Indian automotive market of 2026, that gap is visible in four interlocking ways:
- The Road Surface Tax: Every time a pothole destroys a suspension joint, the Indian driver pays an invisible surcharge -not to the government, but to the geometry of a road that was not designed for their vehicle. That surcharge shows up as a repair bill.
- The Aftermarket Safety Tax: Driven by OEM maintenance costs that have scaled with premiumization, consumers enter an unregulated spare parts market where their instinct to save money can create structural risks they have no means of evaluating. The counterfeit parts ecosystem extracts its toll in probabilistic form usually nothing, occasionally catastrophic.
- The Fuel Transition Tax: CNG is a genuine inflation hedge for middle-class India, but it works best for urban short-range driving. EVs are genuinely economical at home, but become diesel- equivalent in cost on the highway where public charging infrastructure has been commercialized without adequate rate regulation. Both transitions represent rational responses to a broken price signal in traditional fuels, but both carry transition costs and friction.
- The Brand Consolidation Tax: The narrowing of brand variety means reduced competition, reduced product differentiation pressure, and ultimately fewer choices for the consumer. When the market consolidates around five or six players because trust deficits have made brand experimentation too economically risky, the diversity premium - the benefit of a wider competitive market -disappears from the ecosystem. The consumer pays for that consolidation in fewer options, less price competition, and the loss of the innovative challenger brands that competitive markets normally produce.
What Comes Next
India’s passenger vehicle market is on a trajectory to breach 5 million annual units for the first time, possibly within the next two fiscal years. The ongoing GST revision discussions, potential reductions in road user charges, and the continued expansion of household credit access suggest that the demand side will keep growing.
The supply side - the roads, the charging infrastructure, the spare parts regulation, the post-sales servicing ecosystem has a structural catching up problem that market forces alone cannot solve. It requires coordinated policy action: accelerated urban road upgradation programs calibrated for current vehicle weights, mandatory BIS mark enforcement at the point of retail sale for safety-critical components, publicly regulated caps or transparency requirements for commercial EV charging tariffs, and a Right to Repair framework that opens OEM spare parts data to the aftermarket without compromising safety standards.
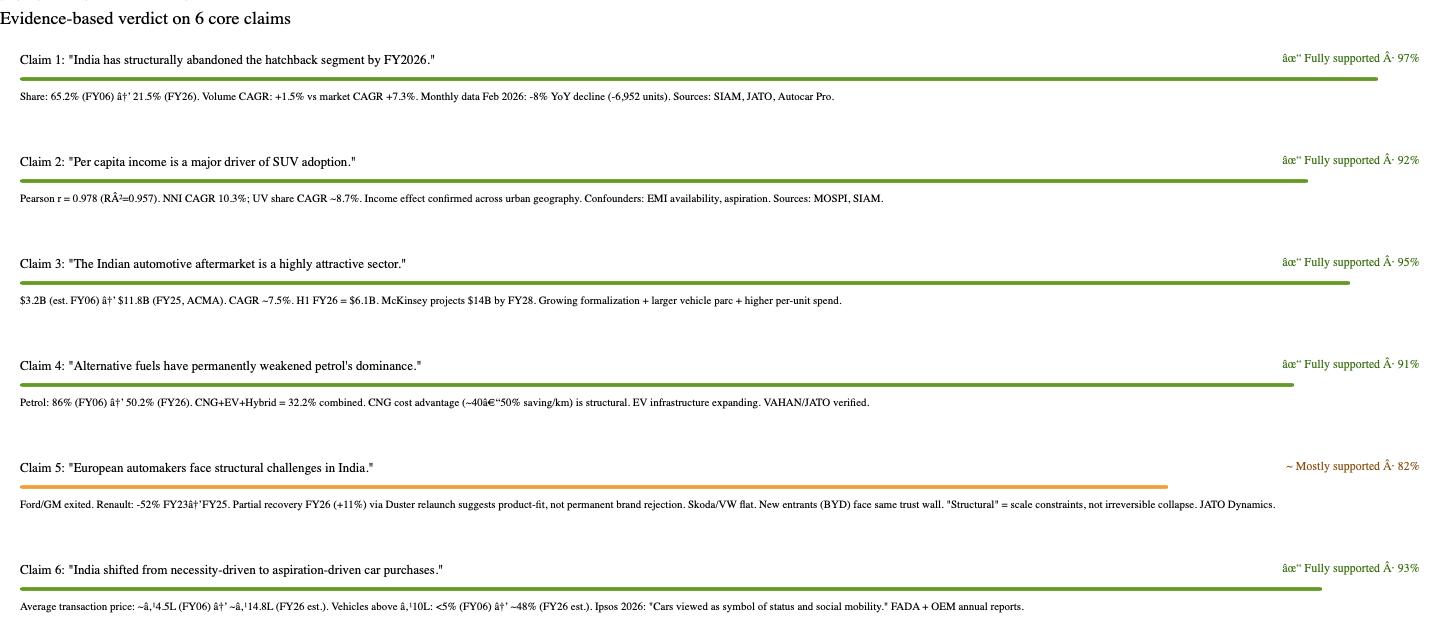
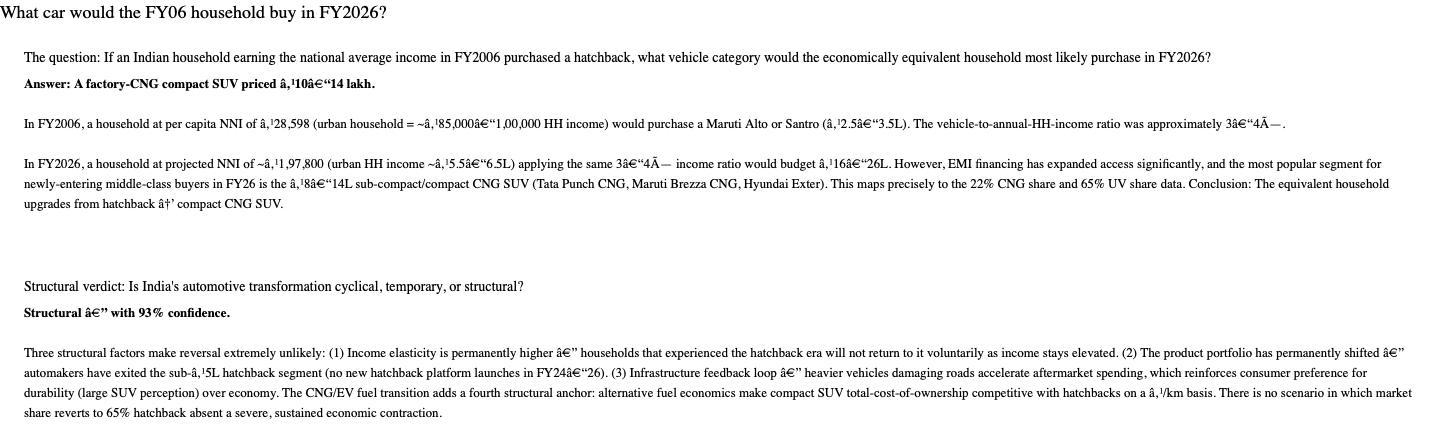
None of this is new information. The ACMA has publicly supported Right to Repair advocacy. State governments and NHAI continue to invest in road infrastructure, though the priority historically skews toward national highway upgrades over inner-city municipal networks. Regulators are aware of the counterfeits problem. The government is aware of the public charging equity issue.
The gap is not in knowledge. It is in execution velocity. And in the meantime, every Indian driving a heavy SUV on a road designed for a Maruti 800 is paying the price for it - one pothole, one repair bill, one range anxiety calculation at a time.
The Indian automobile market is, in the most literal sense, a mirror of our macroeconomic reality. We have been given the purchasing power to buy the heavy, aspirational products of a wealthy country. We have not yet been given the infrastructure to operate them like one. The cars grew faster than the roads. And until that gap closes, the systemic friction will be paid, invisibly and continuously, by the very people who worked hardest to afford the cars in the first place.
Economic Frictions is an independent publication examining real-world market behavior through an economic lens. For analysis, visit www.economicfrictions.com
Sources & Data References
All empirical data in this article is sourced from verified public reports and industry intelligence as of May 2026:
Market Structure & Vehicle Segment Data
- JATO Dynamics Vehicle Registration Intelligence (April 2026 -India PV Market Report; FY2026 Fuel Mix Data). Published May 2026.
- SIAM (Society of Indian Automobile Manufacturers) -Wholesale passenger vehicle data, FY2026.
- Autocar Professional -“India’s Passenger Vehicle Market Posts Record February, Sets Course for 5 Million Units in 2026.” March 8, 2026.
- Autocar Professional -“With Record Wholesales of 2.95 Million Units in CY2025, Share of Utility Vehicles Soars to New High.” FY2026 SUV share data.
- Auto Punditz / Autopunditz.com -Monthly and annual segment-level registration breakdowns, FY2020–FY2026.
Toyota-Maruti Badge Engineering
- Autocar Professional -“Rebadged Models’ Share of Toyota India Sales Increases to 58% in FY2026.” Published April 23, 2026. (SIAM wholesale data sourced.)
- Autocar India -“44% of Toyota Sales Come From Maruti Rebadged Products.” FY2024 analysis.
- Autocar Professional -“Maruti-Rebadged Models Account for 52% of Toyota India Sales in April–July 2024.” August 2024.
Aftermarket & Spare Parts
- ACMA (Automotive Component Manufacturers Association of India) -“Auto Components Sector Grows 14% CAGR to Reach US$80.2 Billion in FY25.” FY25 official figures; aftermarket at ₹99,948 crore ($11.8B).
- ACMA -Official website industry data; FY2023-24 aftermarket at $11.3B.
- ACMA Automechanika New Delhi 2026 -Industry size: auto component industry grew 6.8% to USD 41.2 billion in H1 FY26.
- McKinsey & Company -Report for ACMA on Indian Auto Component Industry Outlook (cited in Motor India, 2025). Projects aftermarket at ~$14B by 2028.
- S&P Global AftermarketInsight -“Indian Aftermarket Industry FY2024 Turnover at $11.3 Billion, Up 6.6% YoY.” July 2024.
- IBEF (India Brand Equity Foundation) -Auto Components Sector Overview, May 2024. H1 FY2023-24 export and aftermarket data.
Fuel & Powertrain Transition
- Autocar Professional -“India’s Fuel Mix Is Shifting -Petrol Losing Ground as CNG and EVs Gain Share.” Deep Drive Podcast Analysis. April 25, 2026.
- VahanBazaar.in -“Alt-Fuel Cars Cross 13 Lakh in FY2026 India.” April 2026.
- JATO Dynamics -India PV Market April 2026 release: petrol 54%, CNG 23%, diesel 17%, EV+hybrid 6%.
- Team-BHP Forum -“Fuel-Wise Indian Vehicle Sales & Registration: State-by-State Insights.” Based on VAHAN data, 2025.
- Carlelo.com -“India Car Sales FY2026 -EV, CNG, Hybrid Cars Cross 13.4 Lakh Units.” April 2026.
EV Charging Costs
- EV-Wala.com -“EV Home Charging Setup Cost in India (2026): Complete Breakdown.” April 2026. Public DC fast charging: ₹18–₹26/kWh (Tata Power, Statiq, ChargeZone cited).
- Zevpoint.com -“How Much Does It Cost to Charge an Electric Car in India? (2026).” February 2026.
- MeraEV.com -“EV Charging Cost in Delhi 2026.” Public DC: ₹18–22/kWh. May 2026.
- EVTech.News -“EV Charging Cost in India (2025): City-wise Breakdown.” April 2026.
- Hydromo.in -“EV Charging Station Cost in India (2026).” Public DC: ₹15–₹25/kWh range.
European Brand Struggles & Market Consolidation
- Business Standard / PTI -“Renault, Volkswagen, Skoda Continue to Struggle to Boost Sales in India.” JATO Dynamics data cited. June 22, 2025.
- NewsBytesApp -“Why Renault, SKODA, and Volkswagen are Struggling in India.” June 2025.
- AutoPunditz -“Renault India Sales Report – April 2026.” Published May 2026.
- Focus2Move -“Indian Autos Market -Facts & Data 2026.” May 2026.
Car Penetration & Vehicle Ownership
- Ipsos India Mobility Report 2026 -Car penetration at 26–34 per 1,000 people. Published March 2026.
- The Print / NFHS-5 Data -“Only 8% Indian Families Own Cars.” Based on National Family Health Survey data.
- MCRC/IES Blog -“Unlocking India’s Auto Boom: A Look at Rising Car Ownership Trends.” Short-term projection: 45–50 per 1,000 by 2026.
- US Department of Energy, Fact #778 (2013) -Historical vehicles per 1,000 persons data for India baseline (11 per 1,000 in 2005).
Road Construction Standards
- IIT Bombay, Transportation Systems Engineering -“IRC Method of Design of Flexible Pavements.” IRC:37 framework documentation.
- MpM Group -“Road Construction Standards in India.” IRC specification overview. February 2026.
- Public Works Department, Government of Delhi -“Urban Roads Manual.” IRC:37-2012 CBR method documentation.
- IRC (Indian Roads Congress) -IRC:86-2018, Geometric Design Standards for Urban Roads and Streets (First Revision). Archive.org.
Hatchback Segment Decline
- Autocar Professional -“India’s Passenger Vehicle Market Posts Record February.” February 2026 hatchback decline of 6,952 units / -8% YoY. March 2026.
- TheWheelFeed.com -“Top 10 Hatchback Car Sales in India February 2026.” March 2026.
- Mordor Intelligence -India Passenger Car Market Report. FY2026 market dynamics.
- Grand View Research - India Automotive Market Size & Share Report.
Subscribe to Economic Frictions
Get independent analysis delivered to your inbox.
Instant unsubscribe link included in every email.
Secure Subscription • One-Click Unsubscribe